CMU NASA LUNABOTICS / AVIONICS
Rover avionics and testing
I’m part of the avionics subteam for CMU’s NASA Lunabotics team, where I’ve worked on motor control, power-system modeling, embedded testing, and electrical integration. My work spans the 2025–26 Atlas rover, the development of Orion for 2026–27, and several smaller test platforms.
- MATLAB
- LTspice
- ODrive
- Wiring & integration
Kraken X60 motor control
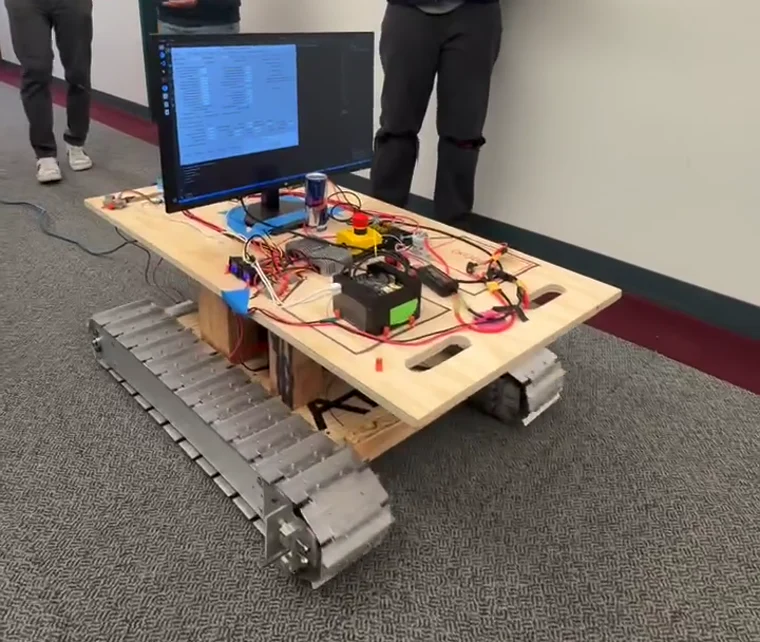
For the 2026–27 Track Bot, I developed Python software to control two Kraken X60 motors over CAN using a Raspberry Pi 4, CANivore, and Phoenix 6.
I wrote separate tools for manual driving with an Xbox controller and controlled velocity tests. The testing scripts log motor velocity, current, and fault information to CSV files, along with JSON test records. The team has since used the setup for mechanical testing.
I also reworked parts of the existing motor wiring, including replacing and crimping connectors.
Power-distribution modeling
I built an LTspice model of the team’s preliminary Orion power-distribution system to examine voltage drops under changing rover loads. The model includes the battery supply, fuses, contactor, wiring resistance, and separate loads for the drivetrain, excavation system, and compute electronics.
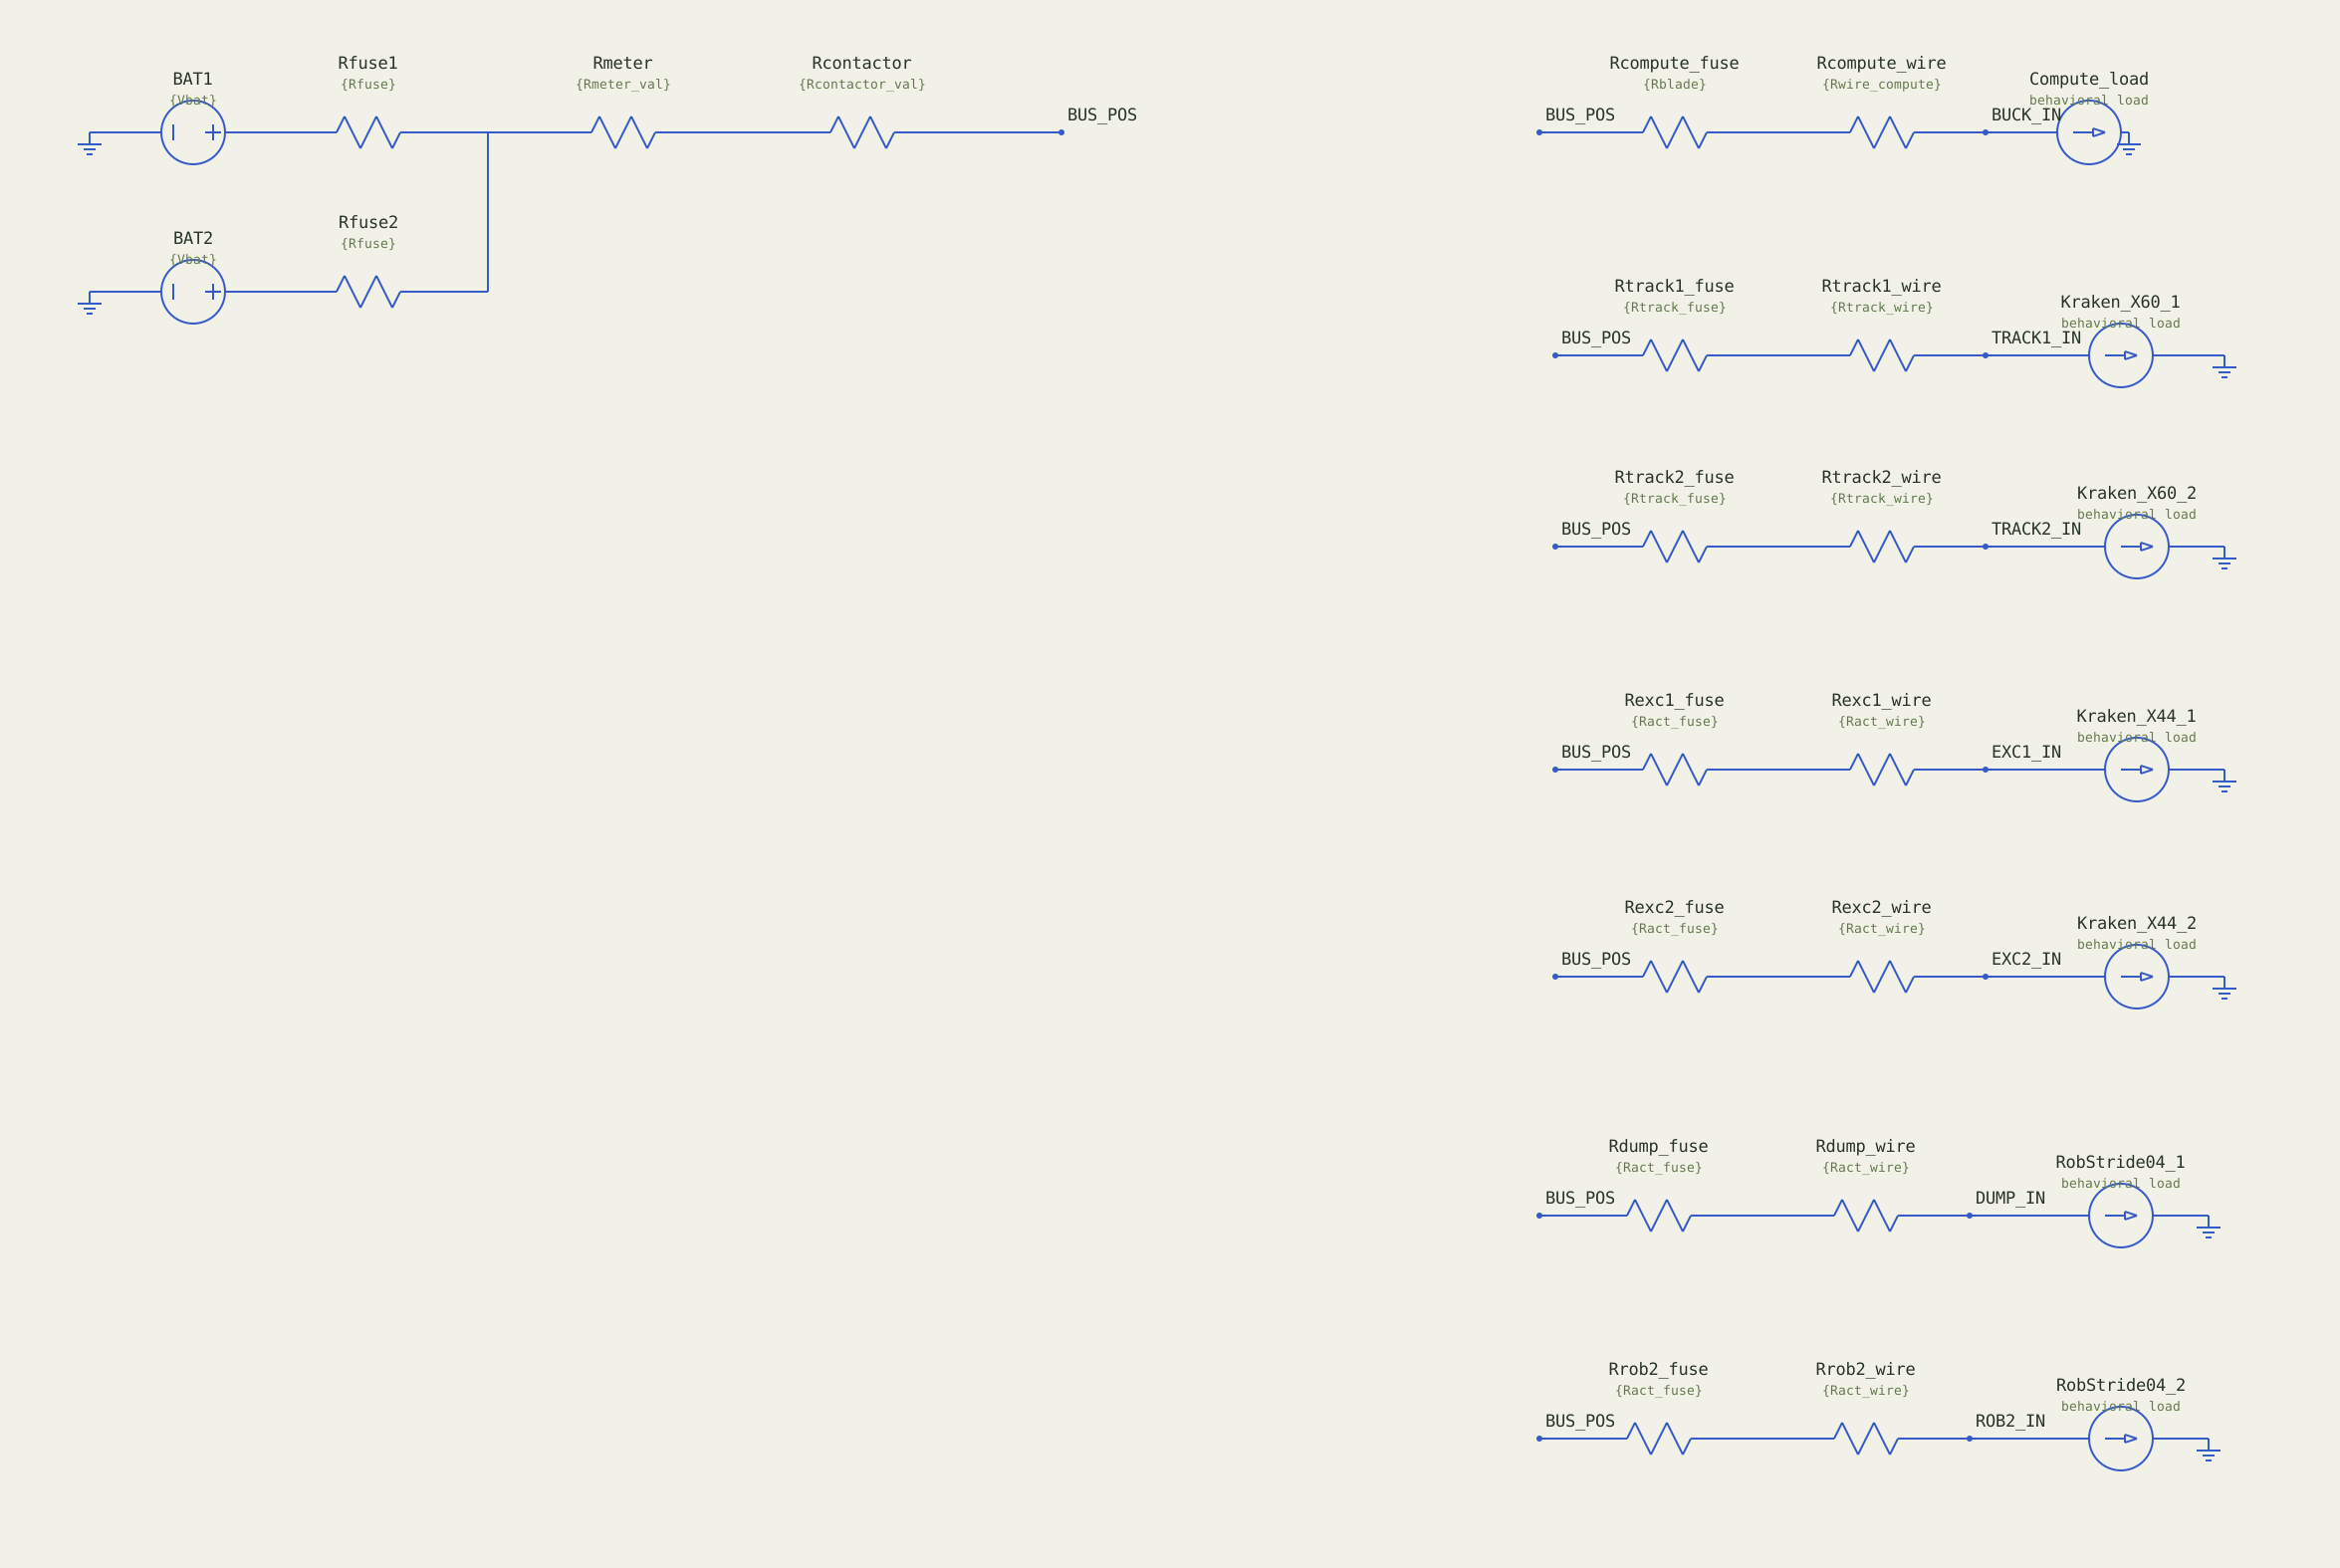
Wire coordinates and symbol geometry come from the staged model’s ASC file and LTspice symbols. Labels are reformatted for readability, and long behavioral expressions are abbreviated. Named BUS_POS connections and ground symbols represent shared electrical nodes.
Simulation results
Loading sample readings…
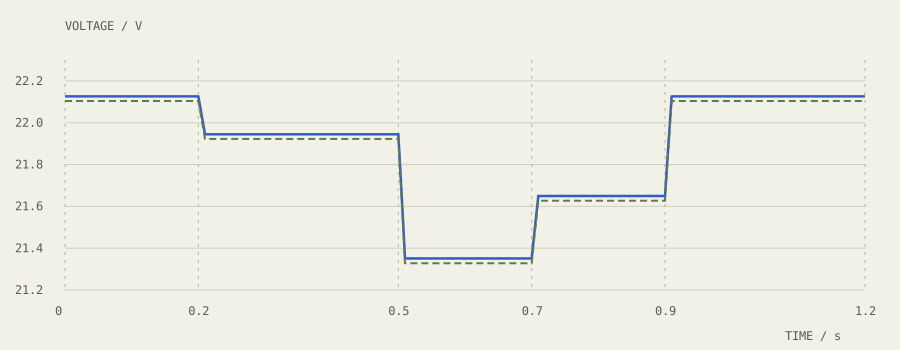
Tracks at 960 W each, with two excavation loads at 240 W each. Transitions take an assumed 10 ms.
Download all sampled waveforms ↓Readings use the nearest saved sample. Current is the magnitude through the common contactor path. This is a simulated operating scenario, not a measured drive cycle.
In the simulated high-load stage, the main bus reaches 21.3508 V against a 22.2 V battery open-circuit baseline. Both track loads request 960 W each, with two excavation loads at 240 W each. The buck input falls to 21.3278 V, and both voltages recover as demand decreases.
This is an earlier 6S design iteration. The team is revising Orion’s power architecture, so the results are preliminary rather than final design or hardware-test values.
Model assumptions and implementation details LTSPICE / ASC / RAW
Distribution path
Two 6S voltage sources in parallel each use 10 mΩ of internal resistance and 0.54 mΩ of modeled fuse resistance. The common path includes 1 mΩ each for the logger and contactor. Each downstream branch has 1 mΩ of fuse resistance and 10 mΩ of wiring resistance. Fuses do not open in this model, and the contactor is represented as a fixed resistance rather than a switching device.
Motor, actuator, and compute loads
I used behavioral current sources to approximate constant-power demand, with a 1 V numerical floor. The modeled branches include two Kraken X60 track loads, two Kraken X44 excavation loads, and two RobStride 04 dump loads. These assignments and power estimates were provisional.
Iload(t) = Prequested(t) / max(Vbranch(t), 1 V)The Jetson and Livox compute branch requests 40.08 W of output power, or approximately 44.53 W of input power at an assumed 90% efficiency. The model represents converter input demand, not a regulated 12 V output or verified undervoltage behavior.
Limits of the simulation
The operating schedule uses five stages with assumed 10 ms transitions and does not exercise every peak-load combination. The model does not simulate motor torque, controller dynamics, regenerative braking, battery discharge, thermal behavior, fuse opening, or converter switching. It is not a verified worst-case test.
I used AI for assistance with behavioral expressions, datasheet research, and resistance estimates. I integrated the circuit, chose the representations, ran the analysis, interpreted the results, and prepared the presentation. The displayed voltage traces were checked against the simulation’s RAW samples and log. Earlier MATLAB and ODrive-based models are separate revisions.
Read artifact provenance ↗Preliminary design review
I presented the model, assumptions, and simulation results on slides 56–57 at the team’s Preliminary Design Review (PDR), attended by faculty and industry reviewers.
Excavation test rig
I wired two H-bridge motor drivers to a Raspberry Pi Pico and programmed manual actuator controls in MicroPython. The controls let the operator extend, retract, and stop the excavation rig’s two mechanically linked linear actuators.
The actuators are mechanically linked rather than independently synchronized with position feedback.
Electrical integration
I wired and soldered an excavation limit switch, helped test its STM32 input with a teammate, supported LiDAR electrical integration, and developed the team’s first avionics documentation package, including schematics, interface specifications, and test procedures.
2025–26 avionics hardware
Photos of the FlatSat bench and rover electrical enclosure from the 2025–26 Atlas season.
2025–26 Track Bot
The team's earlier tracked test platform, built before the Kraken X60 Track Bot.